
co-code 님의 블로그
데이터 불균형 문제 및 완화 방법 본문
- 데이터 불균형 문제
- 정상을 정확하게 분류하는 것과 이상을 정확하게 분류하는 것 중 이상을 정확하게 분류하는 것이 더 중요함
- 일반적으로는 정산의 데이터가 이상의 데이터보다 많다.
- 데이터의 불균형이 발생할 수 있다.
- target 데이터에서 0(정상), 1(이상) 중 0 판단을 더 많이 하게 되는 경우가 발생할 수 있음(예측력이 떨어짐)
- 소수의 데이터의 중요도가 낮게 판단이 되어 실제 모델에서는 해당하는 예측이 적게 발생
- 다수의 데이터와 소수의 데이터의 특정 비율로 조절해주는 샘플링 기법이 존재(언더 샘플링, 오버 샘플링)
- 샘플링을 사용하기 위한 라이브러리(imbalanced-learn) 설치 필요
!pip install imbalanced-learn- 언더 샘플링
- 다수의 라벨을 가진 데이터를 샘플링하여 소수의 데이터의 개수만큼 감소 시키는 방법(데이터 소실)
- 데이터의 불균형 문제는 해결이 되지만 전체의 데이터의 개수가 감소하여 학습의 성능이 떨어질 수 있음
import pandas as pd
from sklearn.datasets import make_classification
from collections import Counter
from imblearn.under_sampling import RandomUnderSampler
x#머신러닝에서는 독립변수와 종속 변수의 이름
#make_classfication() 함수는 데이터가 뷸균형인 랜덤 데이터를 생성 & 결과가 독립변수, 종속변수 따로 데이터를 재공
#불균형 데이터셋 생성
x,y=make_classification(
n_samples=1000,
n_features=5,
weights=[0.9],
flip_y=0
)
x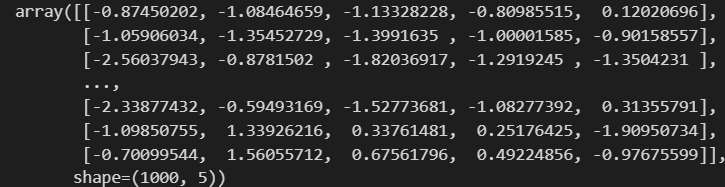
Counter(y)>>> Counter({np.int64(0): 901, np.int64(1): 99})#데이터프레임으로 생성
df=pd.DataFrame(x)
#target 데이터 y도 데이터프레임애 포함
df['target']=y
df.head()
#RandomUnderSampler 라는 class를 생성
undersampler=RandomUnderSampler()

under_x,under_y=undersampler.fit_resample(x,y)
under_df=pd.DataFrame(under_x)
under_df['target']=under_y
under_df['target'].value_counts()>>> target
0 99
1 99
Name: count, dtype: int64#undersampler에서 데이터의 비율을 변경
#class 생성할떄 비율을 지정
#sampling_strategy 매개변수 -> 소수의 데이터의 비율을 의미
undersampler2=RandomUnderSampler(sampling_strategy=0.3)
under_x2,under_y2=undersampler2.fit_resample(x,y)
Counter(under_y2)>>>Counter({np.int64(0): 330, np.int64(1): 99})- 오버 샘플링
- 소수의 데이터를 다수의 데이터의 개수만큼 증가시켜 학습에 사용하기 위한 방법
- 데이터에 손실이 없기 때문에 일반적으로는 언더 샘플링보다는 자주 사용
- 랜덤 오버 샘플링
- 소수의 데이터를 단순 복제하여 다수의 데이터와의 비율을 맞춰주는 과정
- 데이터가 단순하게 복제되기 때문에 데이터의 분포가 변하지 않는다.
- 단순하게 증가시키기 때문에 추가적인 가중치가 발생
- 과적합(overfitting)의 위험성이 존재하지만 데이터 불균형 문제를 해결하는 것이 더 중요함
from imblearn.over_sampling import RandomOverSampler

oversampler=RandomOverSampler()
over_x,over_y=oversampler.fit_resample(x,y)

Counter(over_y)
>>> Counter({np.int64(0): 901, np.int64(1): 901})#소수의 데이터 비율을 다수의 반정도로 샘플링
oversampler2=RandomOverSampler(sampling_strategy=0.5)
over_x2,over_y2=oversampler2.fit_resample(x,y)
Counter(over_y2)>>> Counter({np.int64(0): 901, np.int64(1): 450})- SMOTE
- 소수의 데이터의 관측값에 대한 k개의 최근접 양수를 이윳으로 찾고、관측값과 이웃을 선택된 값 사이에 임의의 새로운 데이터를 생성하는 방법
from imblearn.over_sampling import SMOTE

smote=SMOTE()
sm_x,sm_y=smote.fit_resample(x,y)

Counter(sm_y)
>>> Counter({np.int64(0): 901, np.int64(1): 901})#실제 만들어진 샘플링 데이터의 분포를 확인
import matplotlib.pyplot as plt
import seaborn as snsflg,axes=plt.subplots(2,2, figsize=(15,15))
#4개의 산점도 그래프 생성
sns.scatterplot(
x = x[:,2],
y = x[:,3],
ax = axes[0][0],
hue = y,
alpha = 0.4
)
sns.scatterplot(
x = under_x[:,2],
y = under_x[:,3],
ax = axes[0][1],
hue = under_y,
alpha = 0.4
)
sns.scatterplot(
x = over_x[:,2],
y = over_x[:,3],
ax = axes[1][0],
hue = over_y,
alpha = 0.4
)
sns.scatterplot(
x = sm_x[:,2],
y = sm_x[:,3],
ax = axes[1][1],
hue = sm_y,
alpha =0.4
)
axes[0][0].set_title('Origin Data')
axes[0][1].set_title('RandomUnderSample')
axes[1][0].set_title('RandomOverSample')
axes[1][1].set_title('SMOTE')
plt.show()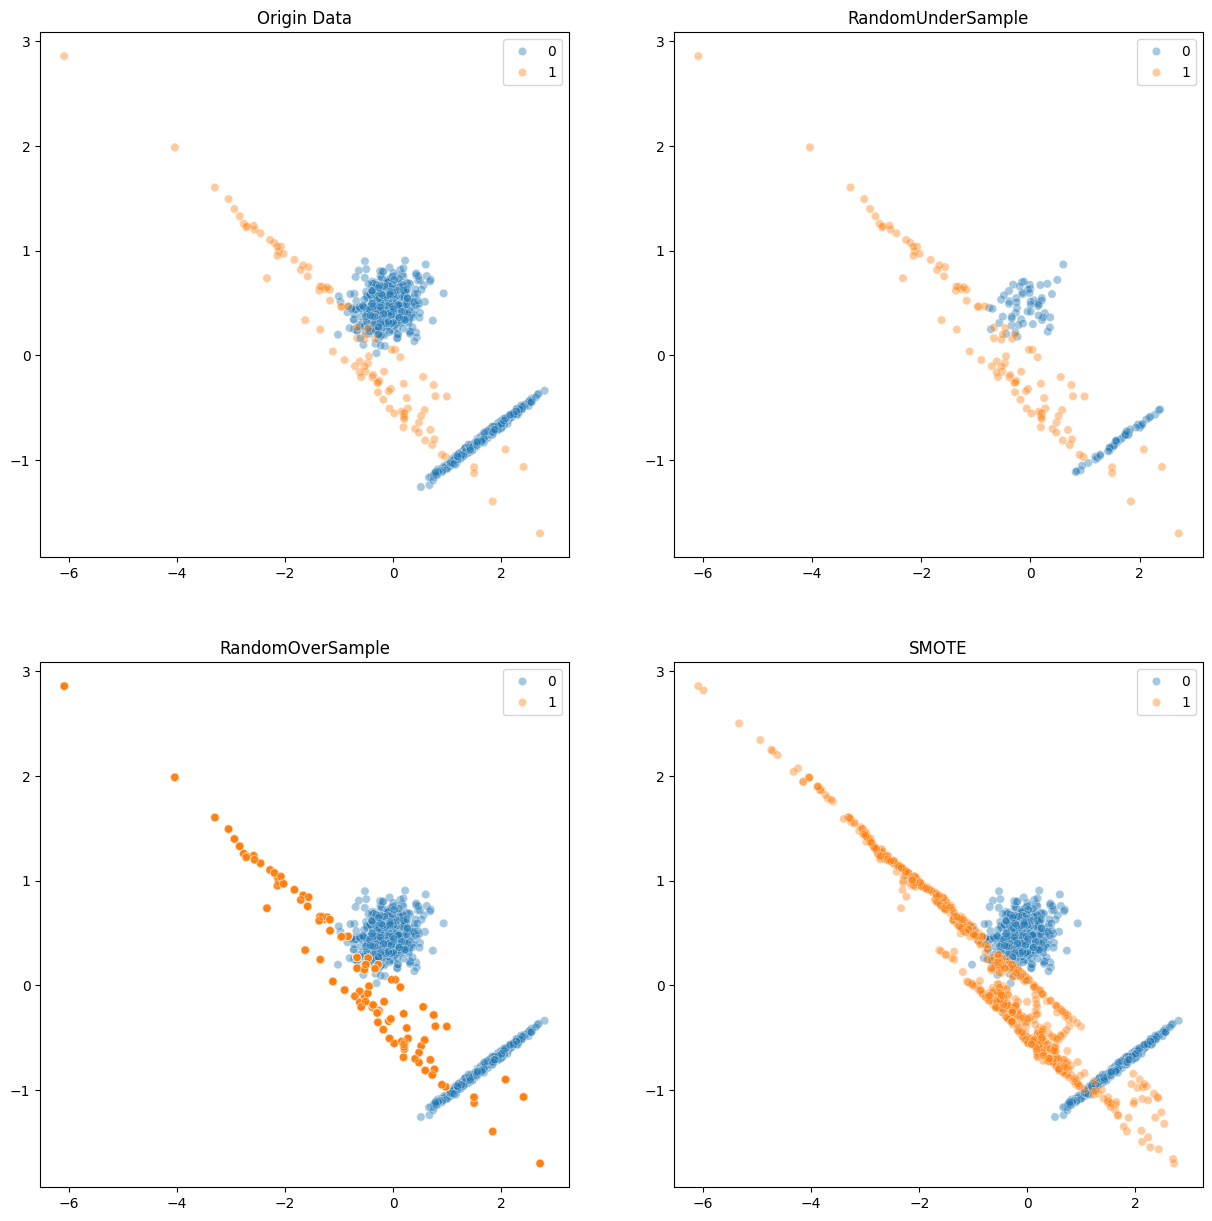
'python' 카테고리의 다른 글
| 부스팅(Boosting) (0) | 2026.05.14 |
|---|---|
| 이진 분류 (0) | 2026.05.13 |
| 이상치 판별 및 처리 (2) | 2026.05.08 |
| matplotlib을 이용한 시각화 (0) | 2026.04.29 |
| 웹 크롤링 (0) | 2026.04.23 |
'python' Related Articles
more


