
co-code 님의 블로그
서포트 벡터 머신(SVM : Support Vector Machine) 본문
- SVM(서포트 벡터 머신)
- 패턴 인식, 자료 분석들을 위한 지도 학습 모델
- 회귀, 분류 모두 존재
- 회귀선에서 일정 양만큼 떨어진 부분에 영역을 생성하여 영역 안과 밖에 있는 데이터들의 가중치를 변화
- parameter(매개변수)
- C
- 기본값 : 1.0
- 규제 강도의 역수
- 마진(margin) 영역의 크기
- kernel(커널 함수의 종류)
- 기본값 : 'ref'
- 실제의 데이터가 선형이 아닌 경우 커널 함수를 이용하여 데이터를 고차원 공간으로 배열하여 직선으로 구분
- 'linear' : 선형 SVM
- 'poly' : 다항식 커널
- 'rbl' : 가우시안 커널 (가장 많이 사용)
- gamma
- 커널의 개수
- kernel이 linear가 아니면 사용
- gamma가 크다면 경계가 복잡해짐 (과적합 위험)
- gamma가 작다면 경계가 유얀해짐 (일반화 위험 : 과소적합 위험)
- degree
- 기본값 : 3
- 다항식 커널에서의 차수
- probability
- 기본값 : False
- 확률을 출력할 것인가? -> True일 경우에는 predict_proba() 사용이 가능
- True로 설정시 추가적인 계산으로 속도가 느려질 수 있음
- C
- 속성
- support_ : 서포트 벡터 경계선에 딱 붙어있는 데이터의 인덱스 값
- support_vector_ : support_의 위치의 값이라면 그 값에 해당하는 실제 데이터의 값
- n_support_ : 클래스(컬럼) 별 서포트 벡터 개수
- coef_ : 결정 계수 (linear 사용 가능)
- 메서드
- decision_function()
- 결정 함수의 값 (margin 과의 차이)
- predict_proba(x)
- 클래스 별 예측 확률
- predict_log_proba(x)
- 클래스 별 예측 로그 확률
- score(x, y)
- decision_function()
import pandas as pd
import numpy as np
import seaborn as sns
import matplotlib.pyplot as plt
from sklearn.model_selection import train_test_split
from sklearn.svm import SVC
from sklearn.metrics import accuracy_score, precision_score, recall_score, f1_score
df=pd.read_csv('../data/classification.csv')
df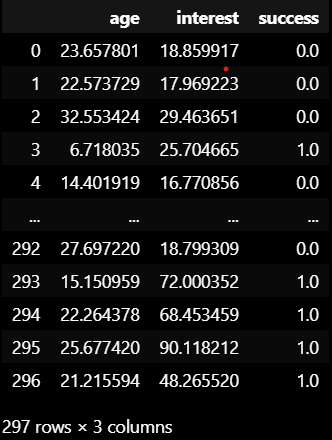
df.info()<class 'pandas.core.frame.DataFrame'>
RangeIndex: 297 entries, 0 to 296
Data columns (total 3 columns):
# Column Non-Null Count Dtype
--- ------ -------------- -----
0 age 297 non-null float64
1 interest 297 non-null float64
2 success 297 non-null float64
dtypes: float64(3)
memory usage: 7.1 KBdf['success'].value_counts()success
1.0 169
0.0 128
Name: count, dtype: int64x=df.drop('success',axis=1)
y=df['success']
X_train,X_test,y_train,y_test=train_test_split(
x, y, test_size=0.3, stratify=y, random_state=42
)svc=SVC()
svc2=SVC(C=0.5)
svc.fit(X_train,y_train)
svc2.fit(X_train,y_train)
pred = svc.predict(X_test)
pred2 = svc2.predict(X_test)

acc=accuracy_score(y_test,pred)
acc2=accuracy_score(y_test,pred2)

prc=precision_score(y_test,pred, average='macro')
prc2=precision_score(y_test,pred2, average='macro')

rcll=recall_score(y_test,pred, average='macro')
rcll2=recall_score(y_test,pred2, average='macro')

f1=f1_score(y_test,pred, average='macro')
f1_2=f1_score(y_test,pred2, average='macro')
print('정확도 : ', round(acc, 2), round(acc2, 2))
print('정밀도 : ', round(prc, 2),round(prc2, 2))
print('재현율 : ', round(rcll, 2), round(rcll2, 2))
print('F1 : ', round(f1, 2), round(f1_2, 2))정확도 : 0.88 0.87
정밀도 : 0.88 0.87
재현율 : 0.88 0.87
F1 : 0.88 0.87
- SVR(서포트 벡터 머신 - 회귀)
- 엡실론 튜브 안에 있는 데이터들은 오차로 보지 않는다.
- 튜브 밖의 데이터에만 패널티 부여
- parameter(매개변수)
- kernel
- linear
- 사용 가능한 매개변수 : C, epsilon
- rbf
- 사용 가능한 매개변수 : C, epsilon, gamma
- poly
- 사용 가능한 매개변수 : C, epsilon, gamma, degree
- linear
- epsilon
- 오차 허용의 폭
- max_iter
- 기본값 : None
- 최적화가 될때까지 최대 반복 횟수(수치가 불안정한 경우 필요 - svm모델에서는 시간이 오래 걸리기 때문에 가급적이면 사용)
- tol
- 기본값 : 0.001
- 수렴의 판단 기준
- 속성
- dual_coef_ : 쌍대문제의 알파 값들
- coef_ : 회귀 계수
- kernel
from sklearn.svm import SVR
from sklearn.metrics import mean_squared_error, r2_scoreboston=pd.read_csv('../csv/boston.csv')x=boston.drop('Price',axis=1)
y=boston['Price']
#train,test 데이터 분할
X_train,X_test,y_train,y_test=train_test_split(
x,y,test_size=0.3,random_state=42,stratify=x['CHAS']
)svr_rbf=SVR(kernel='rbf',gamma='auto', epsilon=0.1)
svr_lin=SVR(kernel='linear')
svr_poly=SVR(kernel='poly',gamma='auto')#랜덤 데이터 생성
x=np.sort(
5 * np.random.rand(40,1),axis=1
)
y=np.sin(x).ravel()#종속변수 y에 노이즈 추가
y[::5] += 3 *(0.5 - np.random.rand(8))svr_lin.fit(x, y)
svr_rbf.fit(x, y)
svr_poly.fit(x, y)
pred_lin=svr_lin.predict(x)
pred_rbf=svr_rbf.predict(x)
pred_poly=svr_poly.predict(x)
index=['RBF','Linear','Poly']
cols=['MSE','R2']
result=pd.DataFrame(index=index, columns=cols)
result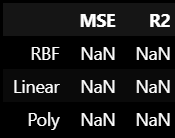
#모델들을 리스트로 생성
preds=[pred_rbf,pred_lin,pred_poly]


for pred, idx in zip(preds, index):
    mse=mean_squared_error(y, pred)
    r2=r2_score(y, pred)


    result.loc[idx, 'MSE']=round(mse,2)
    result.loc[idx, 'R2']=round(r2,2)


result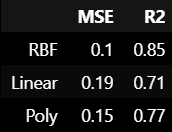
'python' 카테고리의 다른 글
| 랜덤 포레스트(Random Forest) (0) | 2026.05.15 |
|---|---|
| 앙상블(ensemble) 中 배깅(Bagging) (0) | 2026.05.15 |
| 부스팅(Boosting) (0) | 2026.05.14 |
| 이진 분류 (0) | 2026.05.13 |
| 데이터 불균형 문제 및 완화 방법 (0) | 2026.05.08 |
'python' Related Articles
more


